Beyond the open rate: How to use audience insights to improve marketing performance
Last updated: November 4, 2025
Understanding how your audience is engaging, how often you’re reaching them, and whether they’re still in-market is key to improving performance and keeping your campaigns on track. It’s how you measure audience health, and if you're not paying attention to it, you could miss some big warning signs as well as opportunities.
Let’s explore three key audience insights that every marketer should be monitoring and how Acoustic Connect’s audience health dashboard helps you put those insights into action.
Prioritize engagement quality over list size
Having a large list might look impressive on a dashboard, but if most of those contacts are inactive, it’s more vanity than value. What truly matters is how your audience behaves after they’ve joined your list: Are they opening your emails, clicking through to offers, and making purchases? Or are they simply taking up space? When you focus on engagement quality over list size, you gain a clearer picture of who’s contributing to your bottom line and who’s starting to drift away.
This shift in perspective allows you to identify churn risks early and double down on high-intent contacts. Instead of segmenting based on surface-level traits like demographics, start segmenting audiences by behavior and intent, so you can tailor your outreach accordingly:
-
Send active contacts personalized messages that move them closer to conversion
-
Use reactivation strategies to win back lower-engagement segments
It’s about meeting people where they are in their journey with your brand and sending them the right message to move them down the funnel.
How Acoustic Connect helps:
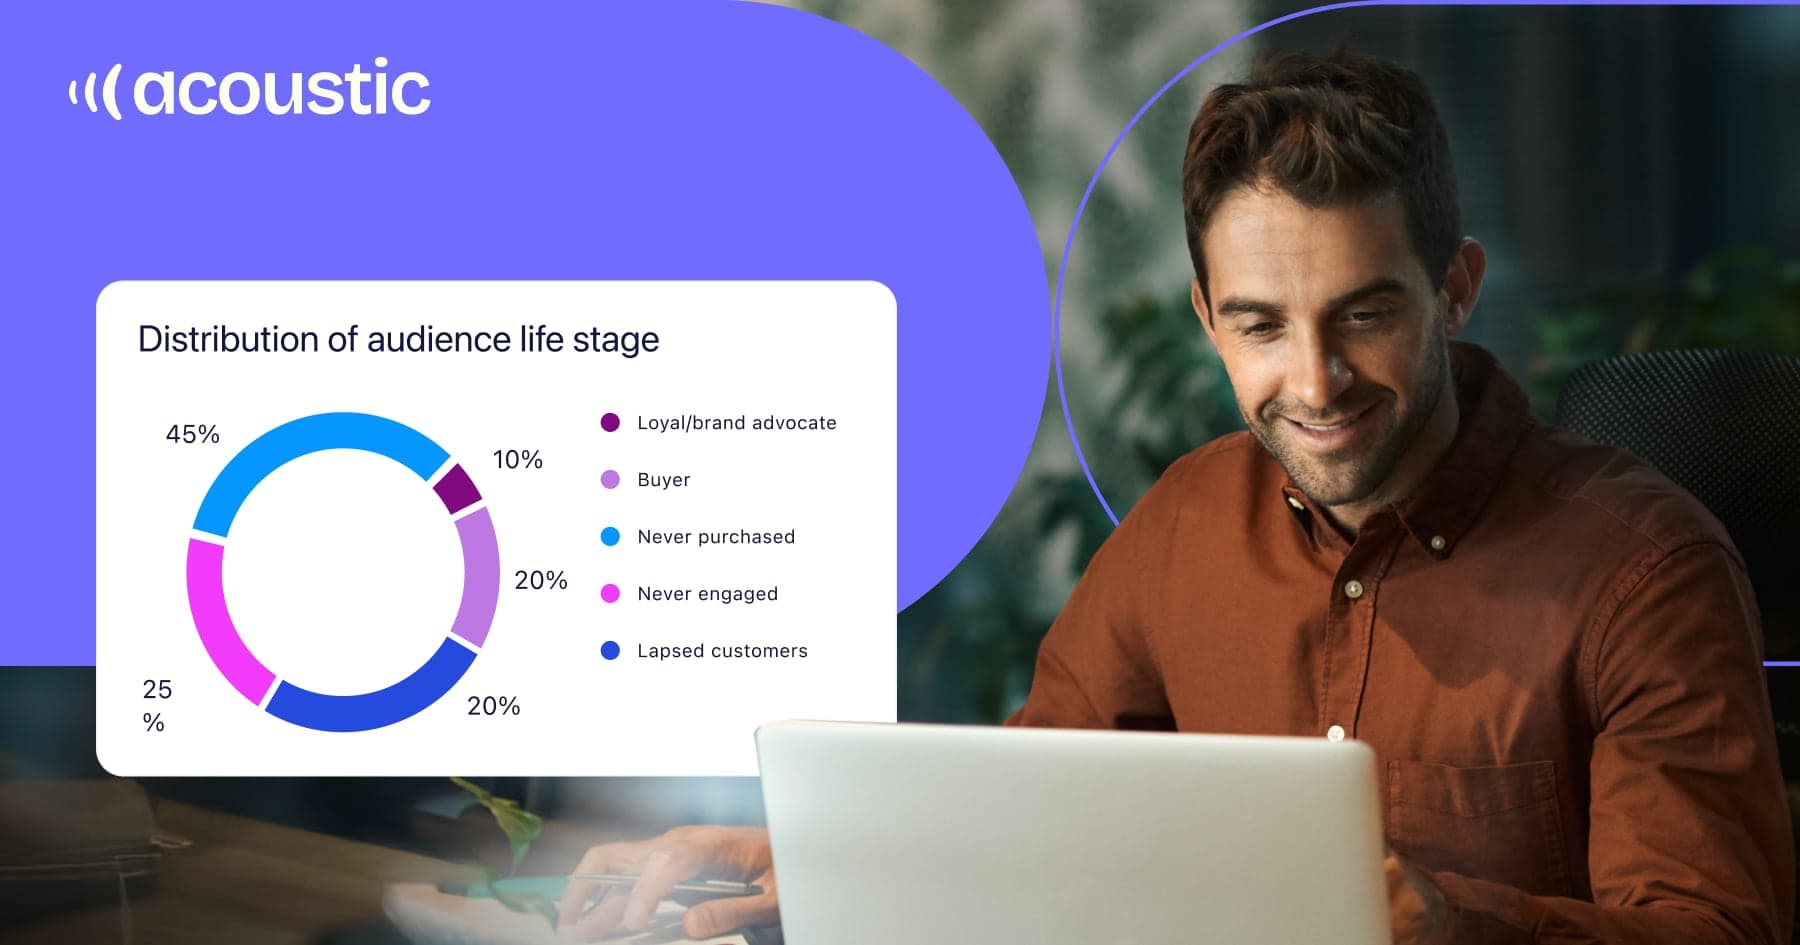
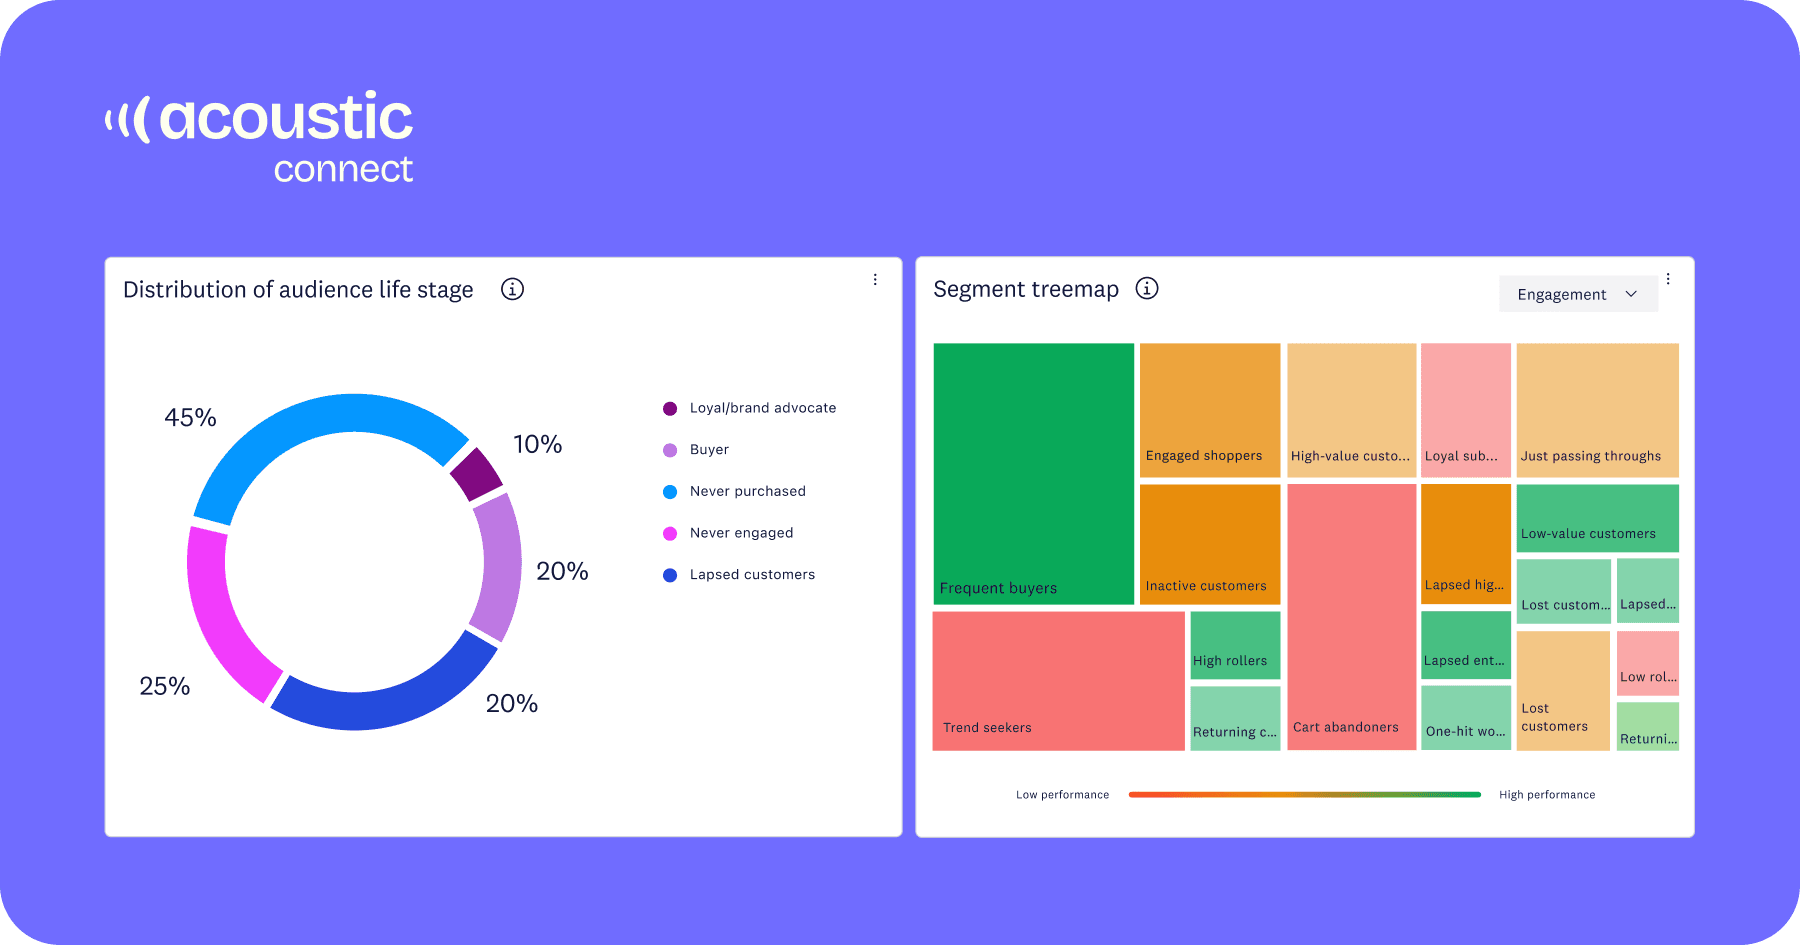
The audience health dashboard surfaces engagement patterns through tools like the audience penetration chart, life stage breakdown, and segment treemap, giving you a clear view of whether contacts are loyal buyers, lightly engaged, or inactive and how your segments are performing. The penetration chart shows you how much of your database you’re truly reaching, while the life stage breakdown highlights churn risks and potential upsell or cross-sell opportunities. Together with the segment treemap, which pinpoints your most engaged groups to guide future messaging, these insights help you identify gaps in your lifecycle marketing strategy and focus your efforts on where they’ll have the most impact.
Don't let frequency hurt deliverability
More messages don’t always translate to more results. Fatigue, unsubscribes, and even spam complaints can all increase when frequency and preferences aren’t carefully managed, and those consequences can seriously damage your deliverability over time.
Give your contacts control over how often — and about what — they hear from you. For example, a guest might want to receive sales offers for their favorite hotel on a weekly basis but opt-out of other brand communications entirely. Honoring those preferences shows you’re paying attention and avoids the uneasy feeling people get when a brand seems to know too much or push too hard.
If you’ve seen a dip in engagement, it might not be your content or your offer — it could just be that your audience is tired of hearing from you too often. Make sure you’re offering contacts frequency and topic preferences. Then try segmenting by recent engagement and adjusting your send cadence accordingly. Pulling back on frequency for colder contacts can protect your deliverability while giving your most engaged audiences more of what they want.
How Acoustic Connect helps:
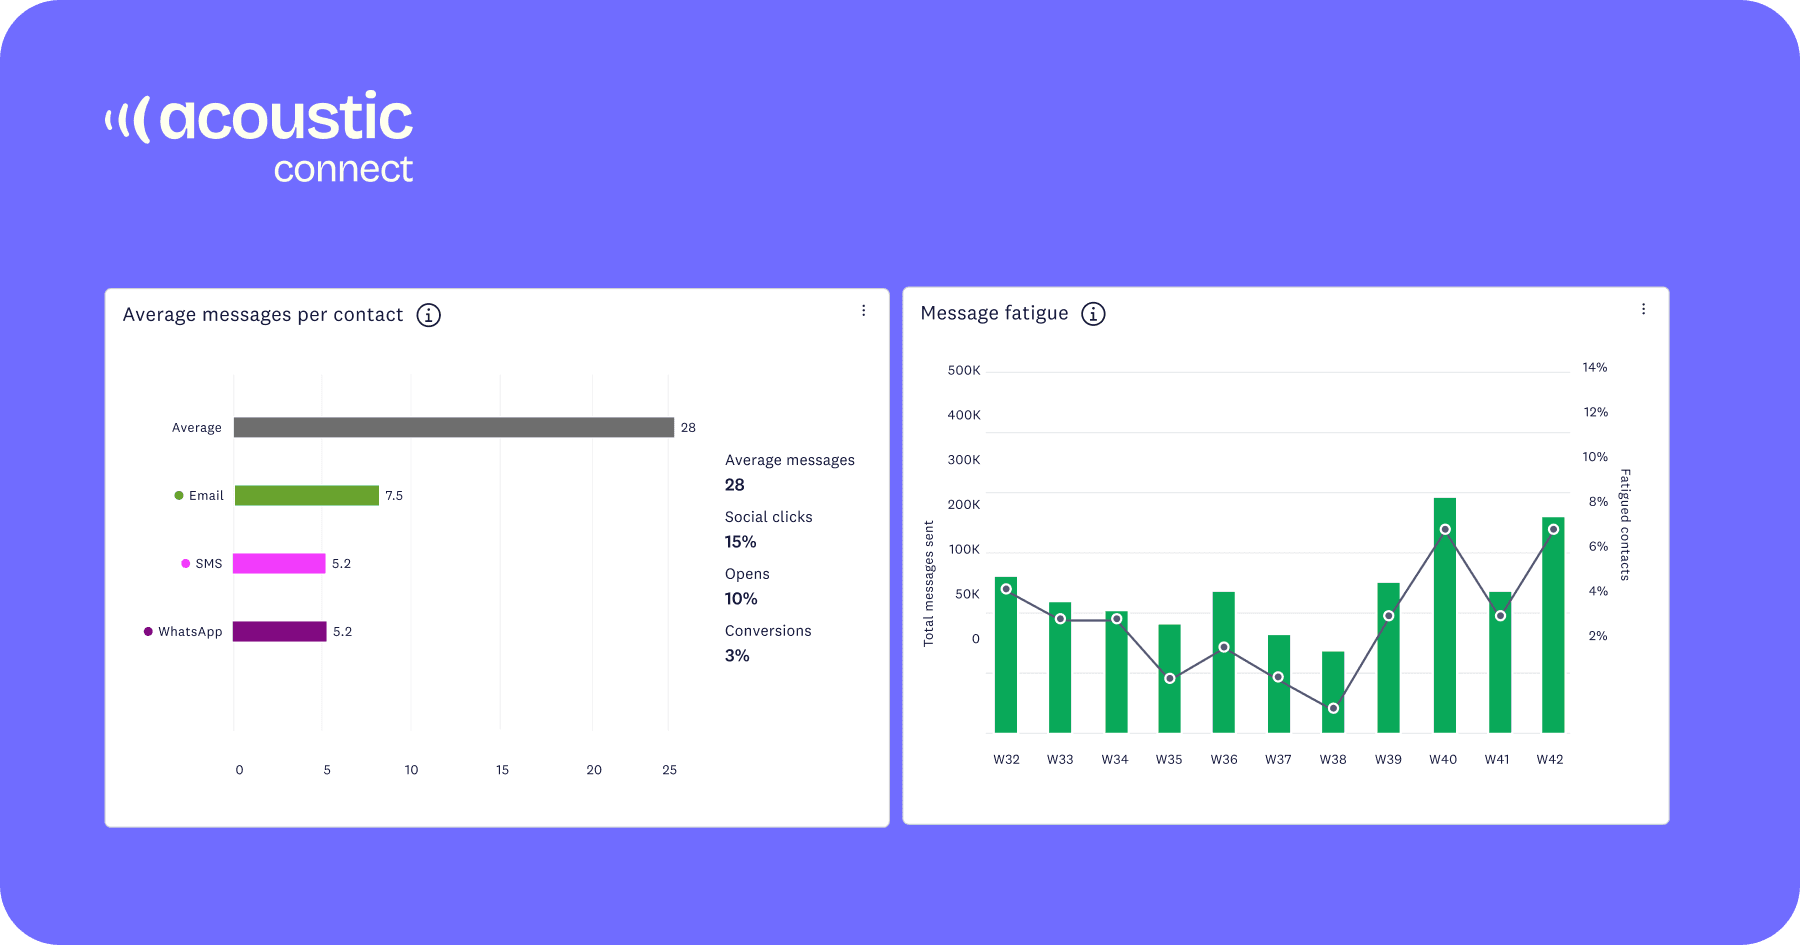
Visualizations make it easy to see how often you’re reaching contacts and how they’re responding. The message fatigue chart helps you identify rising unsubscribes or opt-outs, while metrics like average messages per contact reveal cadence by channel and engagement trends. Built-in tools for managing preference data let you respect contacts’ chosen frequency and topic selections across channels like email, SMS, and WhatsApp. You can quickly rebalance your cadence, suppress disengaged contacts, and preserve deliverability while ensuring your outreach feels intentional and aligned with audience expectations.
Track growth and in-market signals in real time
Audience health depends not only on who’s active today, but on how your audience is shifting over time. As your contact list grows, it’s important to understand whether you’re adding qualified, engaged individuals or losing more than you’re gaining. Trends like rising opt-outs, declining in-market signals, or shrinking engagement windows can reveal a lot about the strength of your acquisition and retention strategies.
By tracking these changes in real time, you can make more informed decisions about where to focus your efforts, whether that’s doubling down on high-performing sources or re-engaging segments at risk. Build a habit of reviewing these signals regularly, so you can time campaigns to match intent and avoid wasted effort on audiences that aren’t ready to convert.
How Acoustic Connect helps:
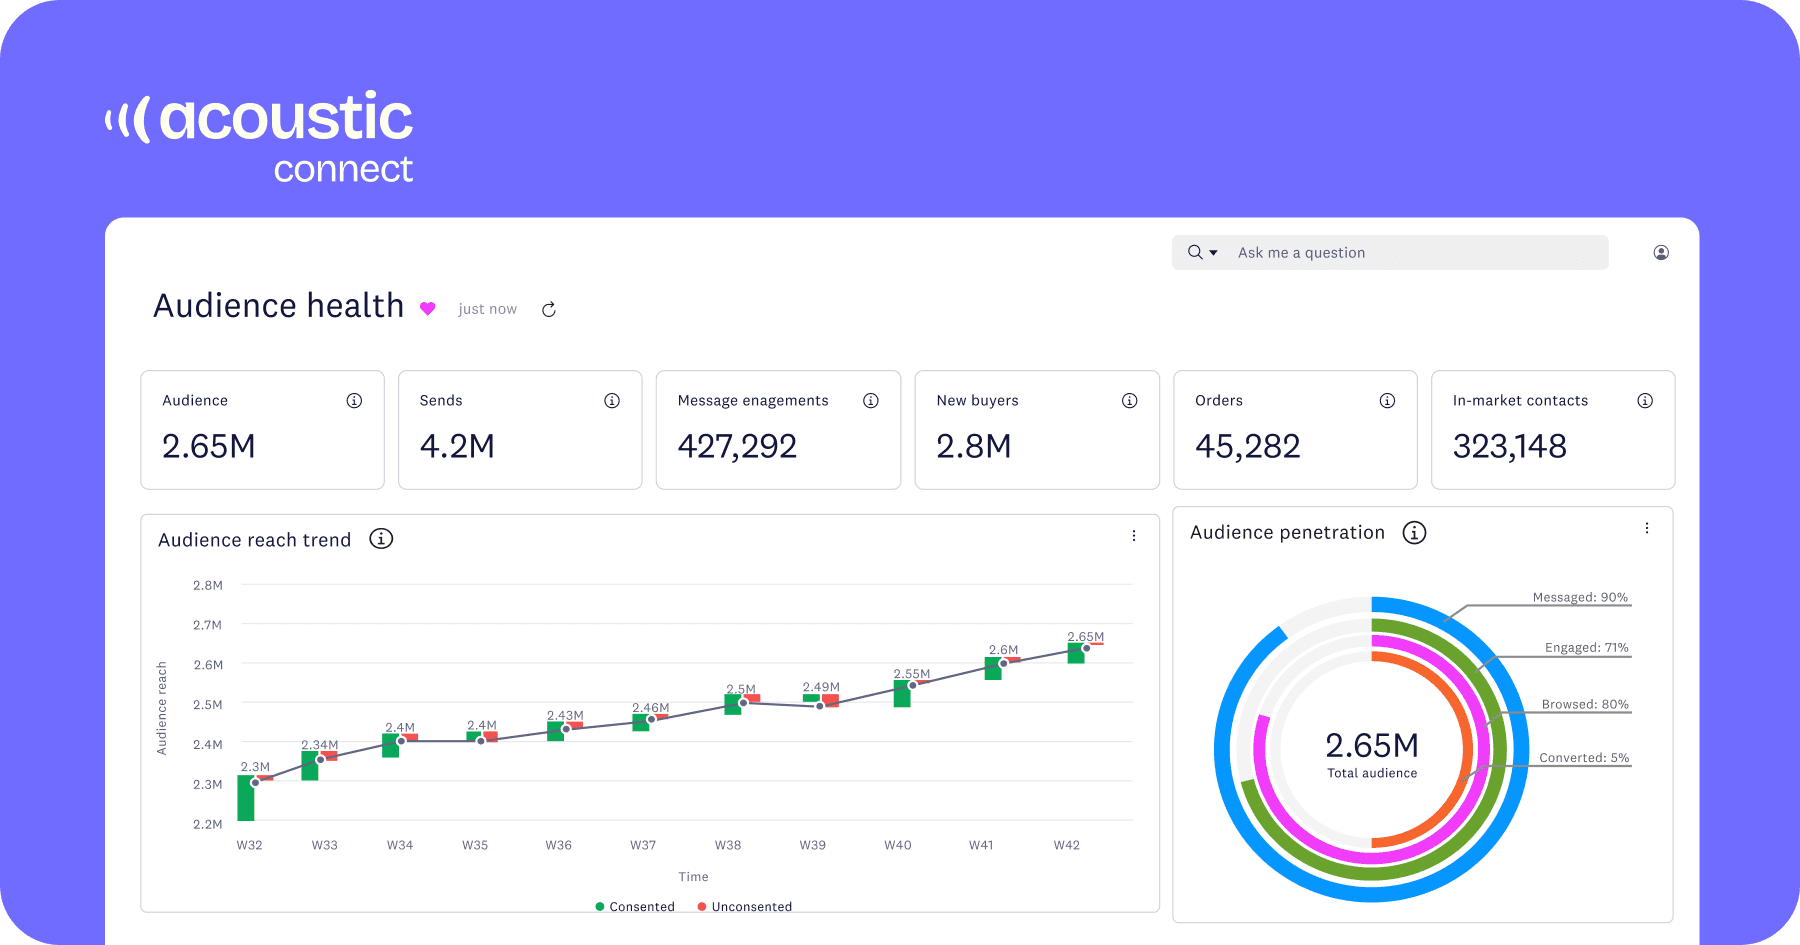
The audience health dashboard gives you a real-time view of key metrics like total audience size, audience reach trend, and how many contacts are currently “in-market.” With filters for channel, date range, and consent group, you can spot momentum or slowdowns early — without jumping between reports or pulling manual data.
Putting audience insights into action
Understanding the health of your audience goes far beyond tracking open rates. By focusing on engagement quality, managing frequency, and monitoring growth and intent signals in real time, you can create more targeted, efficient campaigns that drive better results. With the right insights at your fingertips, it’s easier to adapt your strategy, protect your deliverability, and connect with your audience when it matters most.
If you’re ready to take a closer look at how data can drive smarter marketing decisions, explore our reporting and analytics capabilities or book a demo with our team to see how the audience health dashboard can support your marketing goals.